Where the techniques of Maths
are explained in simple terms.
Calculus - Differentiation - drawing derivative curves.
Test Yourself 1 - Solutions.
- Algebra & Number
- Calculus
- Financial Maths
- Functions & Quadratics
- Geometry
- Measurement
- Networks & Graphs
- Probability & Statistics
- Trigonometry
- Maths & beyond
- Index
| Questions on this page require drawing derivative graphs: |
| 1. Given equations of any of the main types of functions. |
| 2. Given graphs of functions. |
| From given equations.
Draw the graph for each of the given functions in Q 1 - 21. |
|
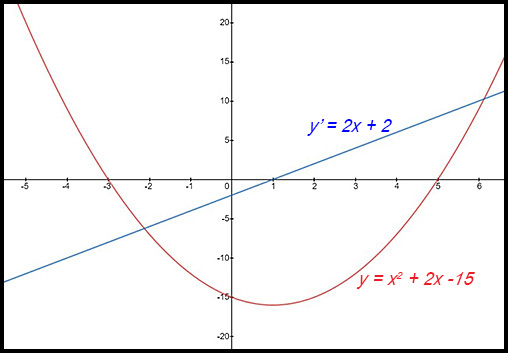
| Given a parabola. | 1. y = (x + 3)(x - 5)
|
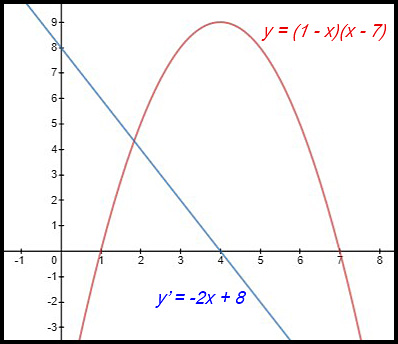
| 2. y = (1 - x)(x - 7)
At x = 4, the derivative curve has a value of 0 |
|
3. (i) 
|
|
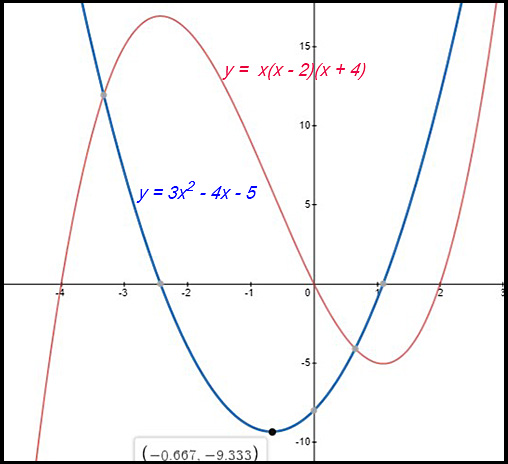
| Given a cubic | 4. y = x(x - 2)(x + 4) = x3 + 2x2 - 8x
At about x = -0.7 (say -0.667), the derivative curve has The original curve at that point has a y value (ordinate) When the derivative curve has a minimum or maximum value |
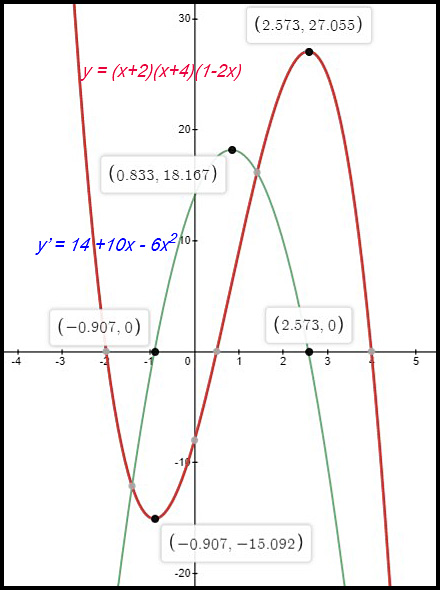
| 5. y = (x + 2)(1 - 2x)(x - 4)
(iii) When x = -0.907, the derivative curve has y = 0 When x = 2.573,
the derivative curve has y = 0 When x = 0.833, the derivative curve has y' = 18.167. |
|
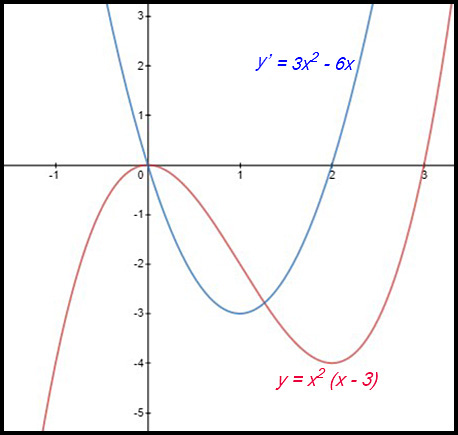
| 6. y = x2(x - 3)
(iii) When x = 0, the original curve is at a local maximum When x = 2, the original curve is at a local minimum When x = 1, the original curve has a value of about -2 |
|
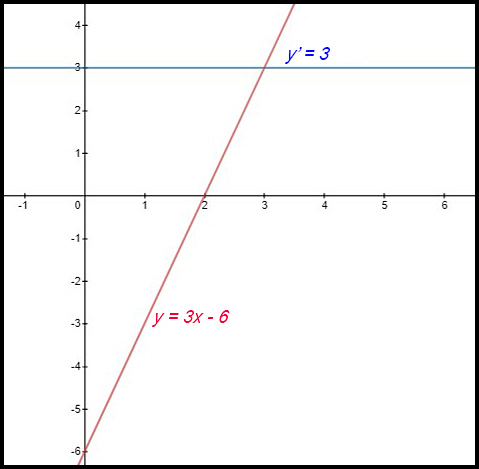
| Given a line | 7. y = 3x - 6
The graph of the line y = 3x - 6 shows an increasing function The graph of the derivative y' = 3 shows the constancy |
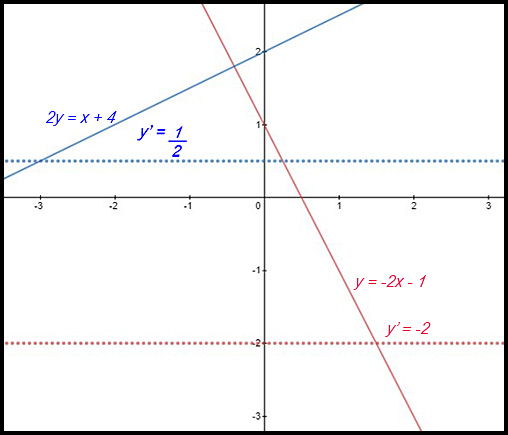
8. y = -2x + 1 and 2y = x + 4
The two original equations have gradients which are perpendicular and so the graphs (in unbroken lines) meet at right angles. The two gradient curves (in dotted lines) are horizontal |
|
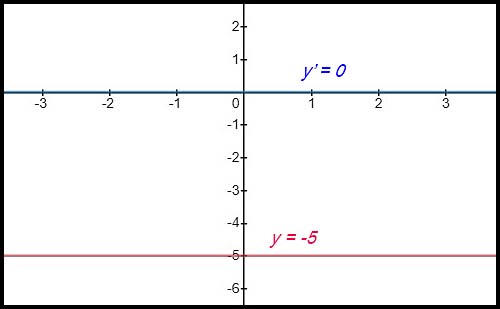
| 9. y = -5.
The original function y = -5 is a straight horizontal line. Hence the graph of the gradient function is also a straight horizontal along the x axis (showing the zero gradient). |
|
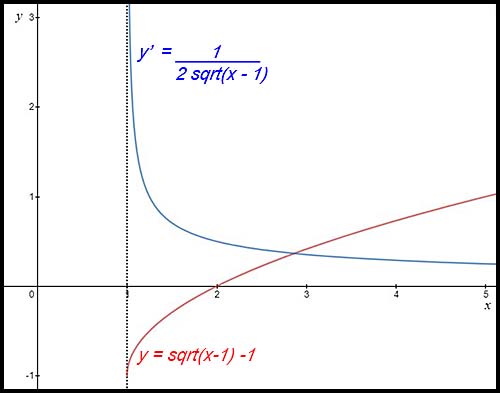
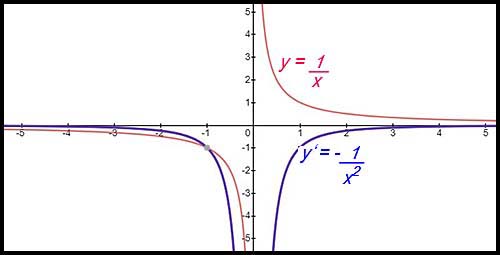
| Given a hyperbola. | 10. 
|
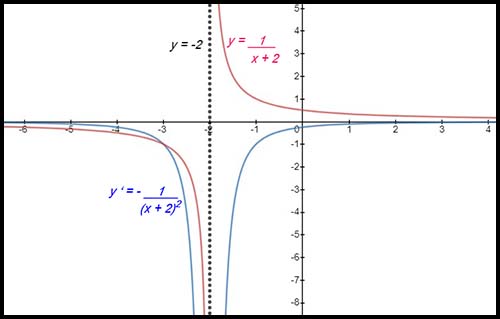
11. 
|
|
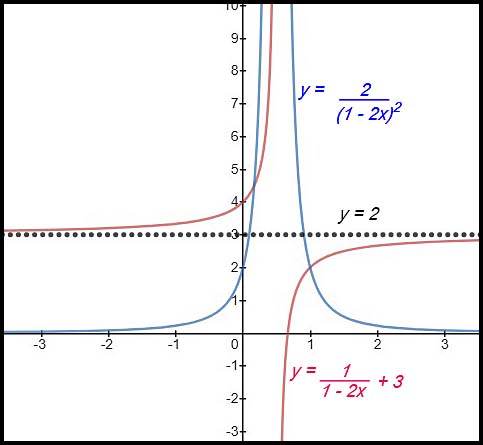
12. 
(i) The original hyperbola is shifted up 3 units. (ii) The constant term for the original function |
|
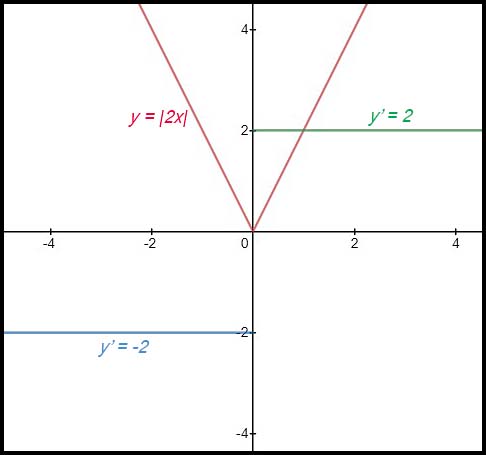
| Given an absolute value. | 13. f(x) = |2x|.
At x = 0, the gradient is undefined. |
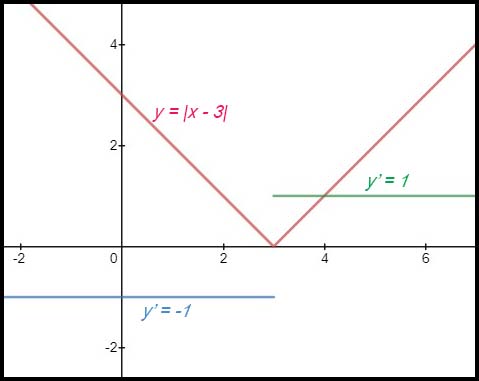
14. f(x) = |x - 3|
At x = 3, the gradient is undefined. |
|
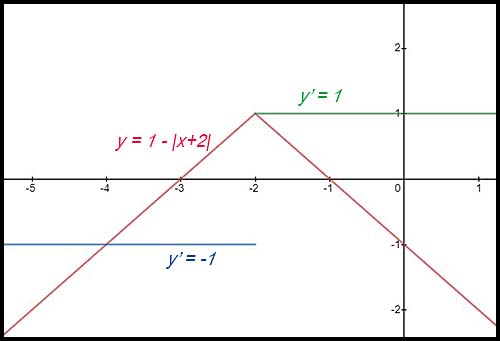
15. y = 1 - |x + 2|
|
|
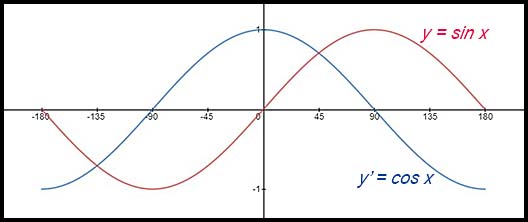
| Given a trig function. | 16. y = sin x for x: [-180°, 180°].
|
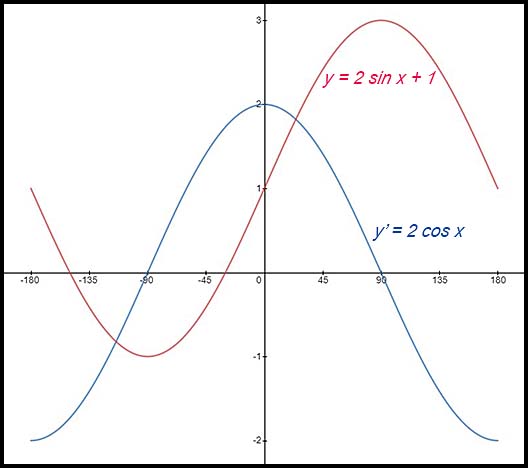
17. y = 2sin x + 1 for x: [-180°, 180°].
|
|
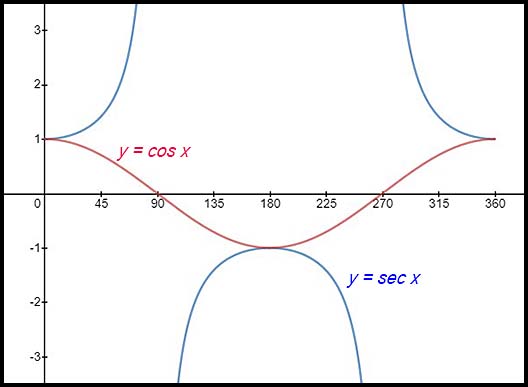
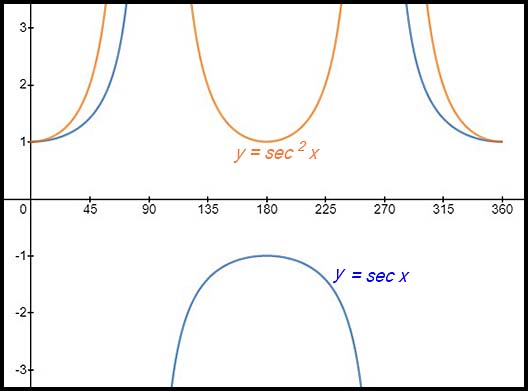
18. (i) Draw y = cos x for x: [0°, 360°].
|
|
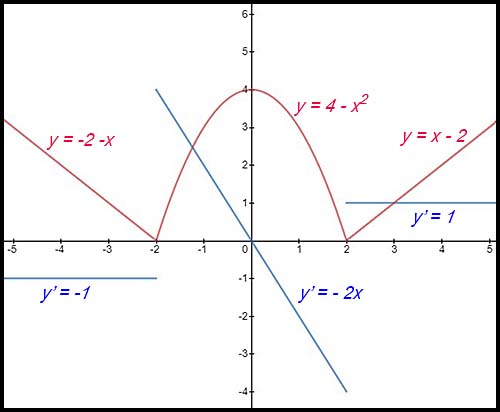
| Mixed functions (piecewise). | 19. y = -2 - x with x: (- ∞, -2]
|
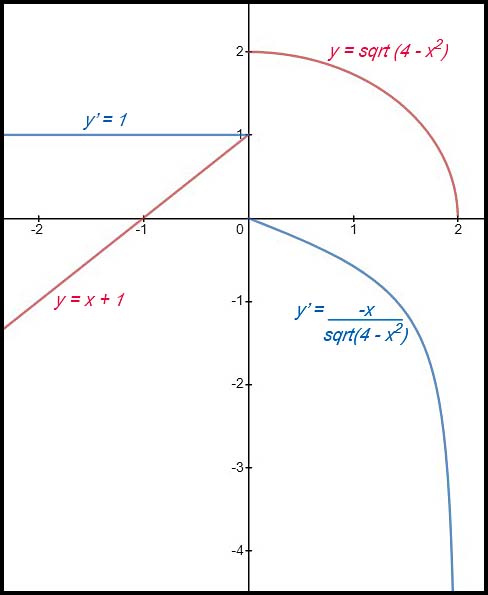
20. y = x + 1 for x: (-∞ , 0]
|
|
| 21. | |
From given graphs. |
|
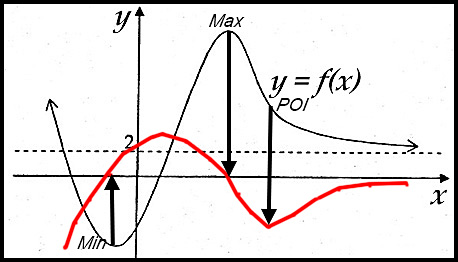
| Given a graph | 22. The graph of y = f(x) is shown below with its derivative curve.
To draw the derivative curve, follow the steps previously outlined: 1. draw arrows from the stationary points to the x axis 2. examine the gradient of the original curve on either side 3. Continue this process for each stationary point.
|
23. 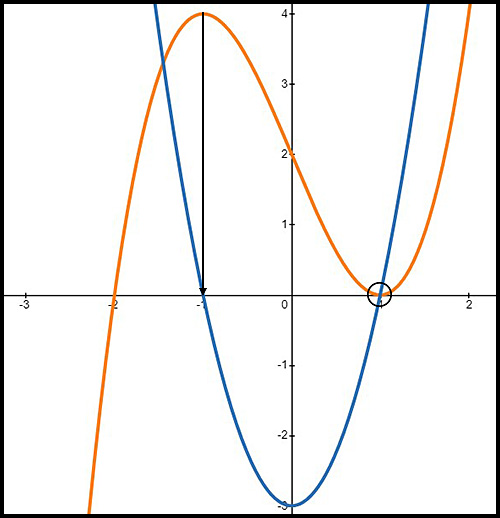
Note: By inspection, the original curve is y = (x + 2)(x - 1)2. As with the previous sketch:
|
|
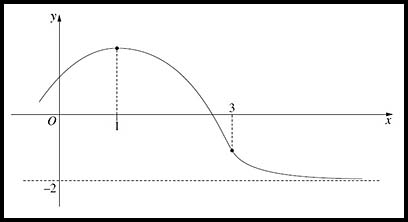
24. The diagram shows a function having:
Try to finish with a smooth graph. |
|
| 25. | |
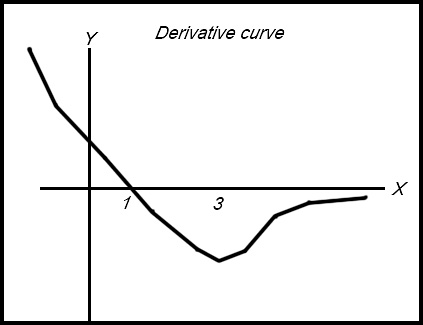
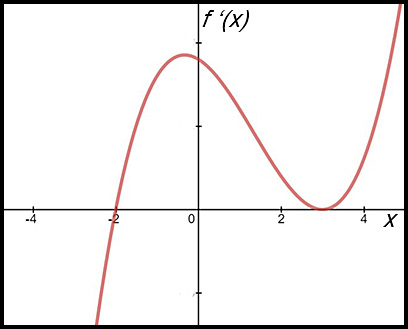
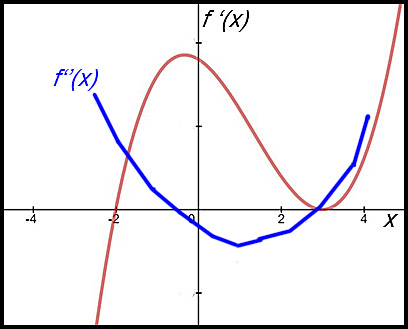
| Drawing a second derivative curve. | 26. The following diagram shows the graph of a derivative function f '(x) for the domain [-2.5, 4]. Assume f (0) = 0.
Make your graph as smooth as you can. |
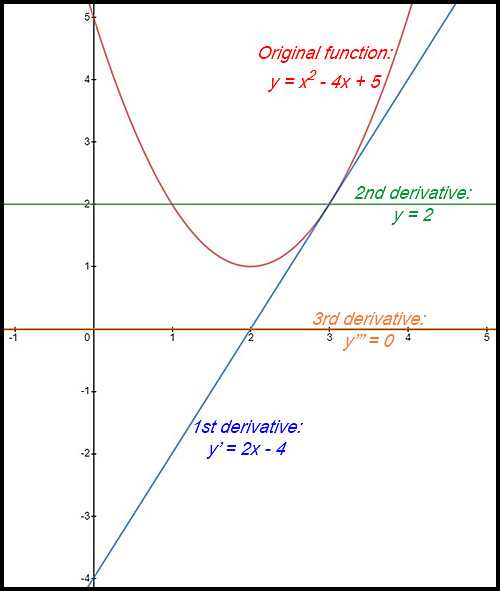
27. (i) For the function y = x2 - 4x + 5.
|
|
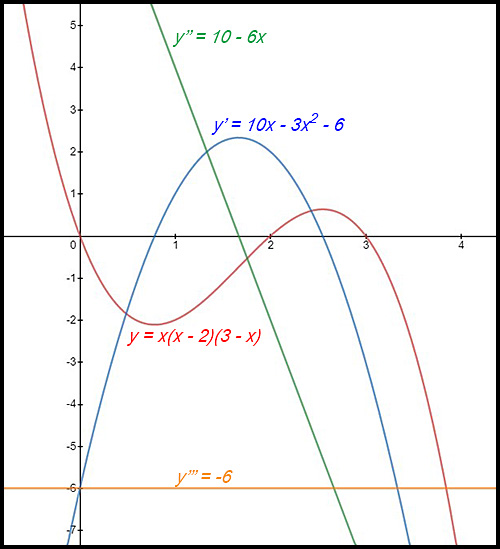
28. For the function y = x(x - 2)(3 - x):
|
|